Beware the Average: Spain's Property Price Paradox
Across Spain, houses sell for more than flats on average. Yet in 20 of the 52 areas covered by the Notariado's provincial statistics, flats have the higher average price. The apparent contradiction reveals why property-price averages need context.
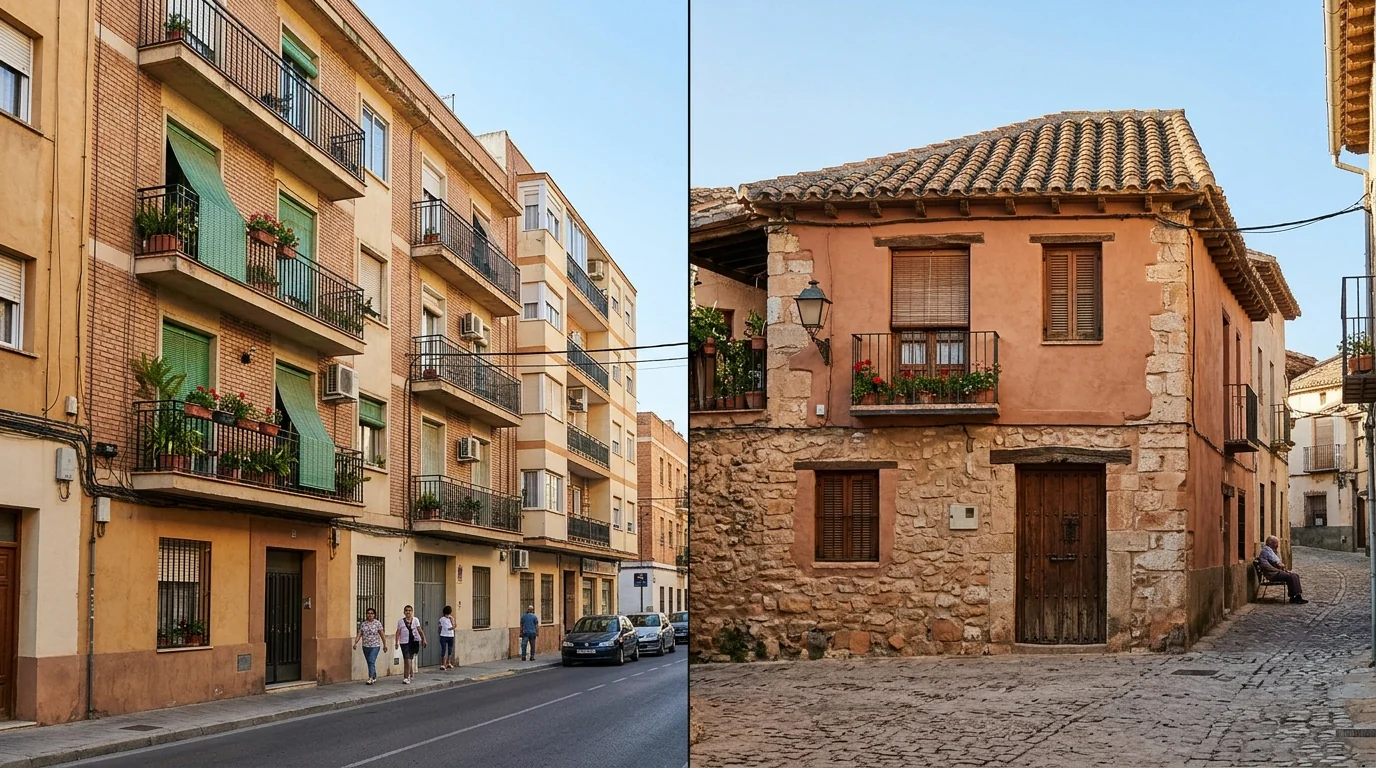
Zaragoza provides a particularly striking example. Houses have higher average prices both in the provincial capital and across the surrounding towns. But combine those transactions, and the provincial average shows flats costing 20.02% more.
The difference comes down to where properties are sold. Most flat transactions take place in the more expensive capital, while most house sales occur elsewhere. The averages themselves aren't wrong, but without knowing what went into them, it's easy to draw the wrong conclusions. This investigation examines how such differences can change the story told by an average.
The National Picture
Across Spain as a whole, flats sell for 62.9% more per square metre than houses, but 12.9% less in total price because the average house sold is nearly twice as large.
Across Spain as a whole, houses sell for more than flats on average when you look at the total price on the title deed (€), while flats sell for more per square metre (€/m²). Across 614,604 residential sales in the Consejo General del Notariado's rolling 12-month dataset (published 21 October 2026), flats sold for an average of €2,385.89/m² - +62.93% more per square metre than single-family houses (€1,464.37/m²).
In total purchase price, the relationship runs the other way: flats average €219,274 compared with €251,605 for single-family houses (-12.85% lower for flats). The difference comes down largely to size. At 171.8 m² on average, houses sold in Spain are nearly twice as large as flats (91.9 m², a 1.87x ratio), so their larger floor area outweighs their lower price per square metre.
The same pattern holds for both resale homes (segunda mano, where flats average €210,830 against €240,234 for houses) and newly built homes (obra nueva, €301,231 against €480,604). Use the chart tabs and expandable table below to inspect the exact figures and transaction counts for each segment.
Show national breakdown table by construction segment
| Construction Segment | Flat Mean Price (€) | Flat €/m² | Flat Area (m²) | Flat Deeds (N) | House Mean Price (€) | House €/m² | House Area (m²) | House Deeds (N) | Flat vs House Total (%) | Flat vs House €/m² (%) |
|---|---|---|---|---|---|---|---|---|---|---|
| All Transactions (Pooled) | €219,274.27 | €2,385.89/m² | 91.90 m² | 463,410 | €251,604.90 | €1,464.37/m² | 171.82 m² | 151,194 | -12.85% | +62.93% |
| Resale Only (Segunda Mano) | €210,829.89 | €2,302.27/m² | 91.57 m² | 417,455 | €240,233.85 | €1,398.11/m² | 171.83 m² | 143,916 | -12.24% | +64.67% |
| New-Build Only (Obra Nueva) | €301,231.43 | €3,167.21/m² | 95.11 m² | 45,955 | €480,603.66 | €2,800.52/m² | 171.61 m² | 7,278 | -37.32% | +13.09% |
The 20 Provinces Where Flats Cost More
In 20 of the 52 areas covered by the Notariado's provincial statistics, flats record a higher average total sale price than single-family houses - led by Teruel (+54.9%) and Cuenca (+54.9%).
In Spain's largest metropolitan and island provinces, houses sell for much higher average total prices than flats - from Madrid (€375,073 for flats vs €622,908 for houses, -39.8%) and Barcelona (-29.5%) to Málaga (-34.2%) and Illes Balears (-58.1%). Across much of inland and northern Spain, however, the provincial figures point in the opposite direction.
The Notariado statistics cover Spain's 50 provinces and the autonomous cities of Ceuta and Melilla - 52 geographic areas in total. In 20 of the 52 areas covered, flats record a higher average total sale price than single-family houses, and in nine provinces the gap exceeds 10% - led by Teruel (+54.89%, €113,064 vs €72,994), Cuenca (+54.86%, €115,424 vs €74,537), Albacete (+43.43%), and Zaragoza (+20.02%). All 20 areas also remain positive when restricted to resale homes; the chart and expandable table below set out the full list.
In highlighted provinces, houses have higher average prices both in the capital and the rest of the province, but flats have higher average prices when all transactions are combined.
Show complete comparison table (20 inverted areas + 6 benchmarks)
| Province / Area | Prov. Flat (€ / N) | Prov. House (€ / N) | Prov. Diff (%) | Capital City Diff (%) | Rest of Prov. Diff (%) | Capital Share (Flats / Houses) | Statistical Mechanism |
|---|---|---|---|---|---|---|---|
| Teruel (44) | €113,064 (N=920) | €72,994 (N=720) | +54.89% | +16.38% (Teruel) | +17.14% | 34.5% / 6.9% | Flats cost more in both capital and rest of province |
| Cuenca (16) | €115,424 (N=1,189) | €74,537 (N=1,319) | +54.86% | +20.52% (Cuenca) | +6.56% | 50.9% / 7.8% | Flats cost more in both capital and rest of province |
| Albacete (02) | €130,427 (N=3,093) | €90,935 (N=1,344) | +43.43% | -21.64% (Albacete) | +1.09% | 59.5% / 12.9% | Flats average less in the capital, but more across the rest of the province |
| Soria (42) | €136,024 (N=829) | €108,534 (N=346) | +25.33% | +9.45% (Soria) | -17.71% | 61.3% / 24.0% | New-build flat sales in capital raise average |
| Ourense (32) | €114,153 (N=1,474) | €92,646 (N=930) | +23.21% | -0.25% (Ourense) | -6.77% | 59.4% / 12.0% | Provincial average reverses local comparison (houses cost more in capital & rest) |
| Badajoz (06) | €106,580 (N=4,279) | €86,785 (N=2,791) | +22.81% | -16.99% (Badajoz) | +6.94% | 36.6% / 10.8% | Flats average less in the capital, but more across the rest of the province |
| Cáceres (10) | €103,398 (N=2,901) | €85,890 (N=1,622) | +20.38% | -27.03% (Cáceres) | +2.11% | 43.0% / 9.5% | Flats average less in the capital, but more across the rest of the province |
| Zaragoza (50) | €170,533 (N=9,719) | €142,084 (N=1,878) | +20.02% | -31.45% (Zaragoza) | -10.00% | 77.6% / 16.8% | Provincial average reverses local comparison (houses cost more in capital & rest) |
| Zamora (49) | €94,304 (N=1,305) | €79,223 (N=623) | +19.04% | -16.63% (Zamora) | -7.62% | 55.3% / 11.4% | Provincial average reverses local comparison (houses cost more in capital & rest) |
| Córdoba (14) | €124,769 (N=6,875) | €115,458 (N=3,218) | +8.06% | -36.66% (Córdoba) | -1.74% | 60.9% / 21.0% | Provincial average reverses local comparison (houses cost more in capital & rest) |
| Navarra (31) | €207,717 (N=4,898) | €194,015 (N=1,589) | +7.06% | -44.29% (Pamplona/Iruña) | -4.64% | 33.6% / 2.1% | Provincial average reverses local comparison (houses cost more in capital & rest) |
| Lugo (27) | €111,954 (N=2,314) | €105,010 (N=775) | +6.61% | -8.71% (Lugo) | +0.54% | 38.3% / 14.4% | Flats average less in the capital, but more across the rest of the province |
| Salamanca (37) | €133,506 (N=3,179) | €126,689 (N=922) | +5.38% | -4.34% (Salamanca) | -28.31% | 57.0% / 5.4% | Provincial average reverses local comparison (houses cost more in capital & rest) |
| Jaén (23) | €87,744 (N=4,840) | €84,038 (N=3,386) | +4.41% | -21.00% (Jaén) | -2.48% | 24.8% / 8.4% | Provincial average reverses local comparison (houses cost more in capital & rest) |
| León (24) | €108,372 (N=3,770) | €104,110 (N=1,924) | +4.09% | +3.33% (León) | -21.14% | 39.9% / 10.1% | New-build flat sales in capital raise average |
| Huesca (22) | €147,716 (N=2,304) | €144,045 (N=812) | +2.55% | -29.18% (Huesca) | +1.94% | 22.0% / 3.7% | Flats average less in the capital, but more across the rest of the province |
| La Rioja (26) | €133,211 (N=3,910) | €130,024 (N=751) | +2.45% | -50.74% (Logroño) | -14.53% | 46.5% / 4.4% | Provincial average reverses local comparison (houses cost more in capital & rest) |
| Ciudad Real (13) | €82,950 (N=3,968) | €81,760 (N=2,516) | +1.46% | -40.06% (Ciudad Real) | -12.70% | 22.7% / 2.3% | Provincial average reverses local comparison (houses cost more in capital & rest) |
| Palencia (34) | €106,437 (N=1,500) | €105,007 (N=643) | +1.36% | -34.81% (Palencia) | -23.34% | 63.7% / 14.3% | Provincial average reverses local comparison (houses cost more in capital & rest) |
| Granada (18) | €153,725 (N=9,101) | €153,124 (N=4,526) | +0.39% | -29.37% (Granada) | -9.69% | 33.4% / 6.9% | Near-parity reversal (+0.39% / €602 provincial gap; houses cost more in capital & rest) |
| Sevilla (41) | €176,329 (N=16,078) | €177,828 (N=7,510) | -0.84% | -33.23% (Sevilla) | -11.74% | 49.5% / 12.0% | Houses cost more than flats (standard pattern) |
| València/Valencia (46) | €182,812 (N=28,587) | €195,156 (N=7,881) | -6.33% | -28.61% (València) | -22.73% | 31.8% / 2.8% | Houses cost more than flats (standard pattern) |
| Barcelona (08) | €264,867 (N=55,885) | €375,532 (N=10,507) | -29.47% | -32.43% (Barcelona) | -39.41% | 26.3% / 4.5% | Houses cost more than flats (standard pattern) |
| Málaga (29) | €336,475 (N=22,833) | €510,981 (N=6,970) | -34.15% | -30.98% (Málaga) | -33.31% | 21.7% / 9.8% | Houses cost more than flats (standard pattern) |
| Madrid (28) | €375,073 (N=60,386) | €622,908 (N=8,464) | -39.79% | -59.34% (Madrid) | -48.47% | 55.5% / 13.8% | Houses cost more than flats (standard pattern) |
| Illes Balears (07) | €398,129 (N=9,805) | €950,044 (N=2,505) | -58.09% | -58.01% (Palma) | -57.52% | 36.7% / 14.4% | Houses cost more than flats (standard pattern) |
The Zaragoza Paradox
In Zaragoza province, houses have higher average prices both in the capital city and across the rest of the province - yet the province-wide average is 20.0% higher for flats.
Seeing that flats have a higher average price than houses across a province can make it look as if flats cost more than houses in that market. In 10 of those provinces (plus Granada at virtual parity), however, separating the provincial capital from the surrounding municipalities tells the opposite story.
Take Zaragoza province. Inside Zaragoza city, houses have a higher average transaction price than flats (€277,081 vs €189,936, or -31.45% lower for flats). Across the rest of the province outside the capital, houses also have a higher average price than flats (€114,877 vs €103,392, or -10.00% lower for flats). Yet when all transactions across Zaragoza province are combined into a single province-wide figure, flats average +20.02% more than houses (€170,533 vs €142,084).
The provincial figures aren't wrong. They simply combine very different local markets in very different proportions. That is why an average price for an entire province can be a poor guide to what buyers pay in a particular town.
This happens because flat and house transactions are distributed very differently across the two areas. More than three-quarters of Zaragoza's 9,719 flat sales (77.58%) take place in the higher-priced capital city, whereas 83.23% of its 1,878 house sales take place in smaller towns and villages outside the capital where property prices are much lower. Consequently, the provincial flat average is dominated by urban sales in Zaragoza city, while the provincial house average is dominated by rural and small-town sales.
Statisticians call this Simpson's paradox: a pattern that holds in every separate part of a dataset can reverse when those parts are combined. Ten provinces show a clear reversal of more than 1% at the provincial level: Zaragoza (+20.02% overall vs -31.45% in the capital and -10.00% across the rest of the province), Ourense (+23.21%), Zamora (+19.04%), Córdoba (+8.06%), Navarra (+7.06%), Salamanca (+5.38%), Jaén (+4.41%), La Rioja (+2.45%), Ciudad Real (+1.46%) and Palencia (+1.36%). An eleventh province, Granada, shows the same mathematical pattern (-29.37% in the capital and -9.69% across the rest of the province), but its combined provincial difference is just +0.39% (€153,725 vs €153,124, a gap of €602), which we treat as near-parity rather than a clear provincial flat premium.
Show exact transaction-weighting math and all 10 Simpson's paradox provinces
Exact weighted verification for Zaragoza province (code 50): Pooled apartment mean = (7,540 x €189,936.36 + 2,179 x €103,391.71) / 9,719 = €170,533.04. Pooled house mean = (315 x €277,081.09 + 1,563 x €114,877.19) / 1,878 = €142,083.92 (+20.02% pooled flat vs house). Restricting the non-capital group to unsuppressed municipalities with >= 4 deeds yields the same directional result (-11.88%: €109,485 across 2,030 flats vs €124,252 across 1,348 houses).
Ten provinces show a local-to-provincial reversal with a combined provincial difference above 1% (pooled provincial % vs capital % and rest-of-province %): Ourense (+23.21% pooled vs -0.25% capital and -6.77% rest), Zaragoza (+20.02% vs -31.45% and -10.00%), Zamora (+19.04% vs -16.63% and -7.62%), Córdoba (+8.06% vs -36.66% and -1.74%), Navarra (+7.06% vs -44.29% and -4.64%), Salamanca (+5.38% vs -4.34% and -28.31%), Jaén (+4.41% vs -21.00% and -2.48%), La Rioja (+2.45% vs -50.74% and -14.53%), Ciudad Real (+1.46% vs -40.06% and -12.70%), and Palencia (+1.36% vs -34.81% and -23.34%). An eleventh province, Granada, satisfies the same inequality (-29.37% in Granada city and -9.69% in the rest of the province, or -8.67% across unsuppressed non-capital municipalities), but its combined provincial difference is +0.39% (€153,725 vs €153,124, a difference of €602) and is classified separately as a near-parity case (< 1%).
Checking a specific property or street in Spain?
Search any Spanish address to inspect neighbourhood walkability, public transport frequencies, schools, flood hazards, and official area price benchmarks.
Where Flats Have Higher Average Prices in the Same Town
To test whether flats ever cost more than houses within the same municipality, we moved from provincial totals to town-by-town figures. Even within a single town, however, comparing all sales can mislead when newly built apartment blocks are mixed with older village houses.
To avoid distortions from very small markets, we focus on municipalities with at least 50 recorded sales of each property type. Across Spain, 560 municipalities meet that volume threshold for all sales combined, and flats have a higher average price than houses in 35 of them (6.25%). When the comparison is restricted to resale homes (vivienda de segunda mano) with at least 50 resale sales of each type, 522 municipalities qualify and 29 (5.56%) still show a higher average price for flats.
To separate durable local patterns from small margins or one-off fluctuations, the chart below applies a stricter test: in addition to that 50-sale resale threshold, flats must exceed houses by at least 5% in the October 2026 dataset and remain higher across all three 2026 Notariado snapshots. Seventeen municipalities pass all three checks, led by Tavernes de la Valldigna (+32.34%, €118,286 vs €89,382), Lorca (+15.22%), Bilbao (+6.77%, €308,294 vs €288,741) and Ontígola (+5.52%, €174,770 vs €165,627, where sold resale flats averaged 165.6 m² compared with 148.6 m² for houses).
In these 17 towns, the gap is not a provincial weighting illusion. In industrial or inland towns such as Tavernes de la Valldigna, Lorca, Elda and Alcoy, resale house transactions include many older village houses in need of renovation, whereas apartments represent more standardized modern housing stock. In dense urban markets such as Bilbao and Cuenca capital, central apartments command high prices per square metre while single-family transactions include older outer-ring properties. Teruel capital also shows a +22.31% resale flat premium (€178,304 vs €145,786), but is listed separately in the chart because it recorded 48 resale house sales (50 across all sales), two short of the 50-sale resale cutoff.
Separating new builds from resales also exposes towns where an apparent all-sales flat premium disappears once newly built apartment promotions are removed. In eight of the 35 municipalities where flats lead across all sales, the comparison reverses in the resale market: in Chipiona (Cádiz), for example, flats average +14.69% more than houses across all sales because 41.2% of apartment transactions are new builds, compared with 6.2% of house transactions, whereas in the resale market houses cost 6.82% more (-6.82% flat-versus-house difference).
Dark blue bars show resale-only markets where flats have a higher average price than houses. Red bars show towns where houses have a higher average price in resale, while the all-sales average is positive.
Show full municipality comparison table (22 municipalities with search filter)
| Municipality (Province) | Resale Flat (€ / m² / N) | Resale House (€ / m² / N) | Resale Diff (% / €) | All-Deeds Diff (% / N) | Market Classification |
|---|---|---|---|---|---|
| Tavernes de la Valldigna (València) | €118,286 (€1,323.88/m², N=272) | €89,382 (€629.89/m², N=91) | +32.34% (€28,905) | +34.04% (N=277/91) | Higher resale flat average (50+ resale sales each & +5% gap) |
| Fernán-Núñez (Córdoba) | €93,079 (€747.94/m², N=67) | €80,044 (€574.88/m², N=55) | +16.29% (€13,035) | +17.75% (N=71/55) | Higher resale flat average (50+ resale sales each & +5% gap) |
| Buñol (València) | €95,193 (€880.04/m², N=69) | €82,579 (€609.74/m², N=53) | +15.28% (€12,614) | +15.28% (N=69/53) | Higher resale flat average (50+ resale sales each & +5% gap) |
| Lorca (Murcia) | €112,492 (€1,109.46/m², N=462) | €97,636 (€805.10/m², N=199) | +15.22% (€14,856) | +10.84% (N=498/216) | Higher resale flat average (50+ resale sales each & +5% gap) |
| Consuegra (Toledo) | €75,133 (€575.47/m², N=59) | €65,581 (€338.16/m², N=63) | +14.57% (€9,552) | +12.42% (N=62/63) | Higher resale flat average (50+ resale sales each & +5% gap) |
| Alcantarilla (Murcia) | €98,004 (€982.66/m², N=488) | €86,312 (€695.17/m², N=83) | +13.55% (€11,692) | +16.57% (N=503/83) | Higher resale flat average (50+ resale sales each & +5% gap) |
| Mula (Murcia) | €77,365 (€670.54/m², N=100) | €68,484 (€399.11/m², N=81) | +12.97% (€8,881) | +12.97% (N=100/81) | Higher resale flat average (50+ resale sales each & +5% gap) |
| Jumilla (Murcia) | €89,013 (€777.09/m², N=145) | €79,410 (€451.23/m², N=130) | +12.09% (€9,603) | +16.10% (N=150/130) | Higher resale flat average (50+ resale sales each & +5% gap) |
| Caravaca de la Cruz (Murcia) | €89,223 (€903.53/m², N=142) | €80,408 (€538.93/m², N=107) | +10.96% (€8,816) | +16.78% (N=155/108) | Higher resale flat average (50+ resale sales each & +5% gap) |
| Requena (València) | €96,097 (€829.80/m², N=143) | €87,563 (€596.25/m², N=126) | +9.75% (€8,535) | +7.79% (N=152/134) | Higher resale flat average (50+ resale sales each & +5% gap) |
| Casares (Málaga) | €325,945 (€2,680.62/m², N=305) | €297,563 (€2,282.36/m², N=65) | +9.54% (€28,382) | +5.17% (N=362/83) | Higher resale flat average (50+ resale sales each & +5% gap) |
| Guadix (Granada) | €88,542 (€798.72/m², N=152) | €81,060 (€503.89/m², N=63) | +9.23% (€7,483) | +9.76% (N=153/63) | Higher resale flat average (50+ resale sales each & +5% gap) |
| Adra (Almería) | €95,386 (€988.22/m², N=177) | €89,263 (€696.55/m², N=120) | +6.86% (€6,123) | +20.76% (N=215/120) | Higher resale flat average (50+ resale sales each & +5% gap) |
| Bilbao (Bizkaia) | €308,294 (€3,599.76/m², N=3,451) | €288,741 (€1,840.60/m², N=64) | +6.77% (€19,554) | +7.94% (N=3,664/66) | Higher resale flat average (50+ resale sales each & +5% gap) |
| Puertollano (Ciudad Real) | €61,353 (€641.85/m², N=615) | €57,767 (€461.53/m², N=268) | +6.21% (€3,586) | +6.27% (N=620/268) | Higher resale flat average (50+ resale sales each & +5% gap) |
| Cuenca (Cuenca) | €136,467 (€1,496.92/m², N=487) | €128,502 (€1,404.85/m², N=103) | +6.20% (€7,965) | +20.52% (N=605/103) | Higher resale flat average (50+ resale sales each & +5% gap) |
| Ontígola (Toledo) | €174,770 (€1,055.21/m², N=56) | €165,627 (€1,114.82/m², N=52) | +5.52% (€9,142) | +4.07% (N=57/55) | Higher resale flat average (50+ resale sales each & +5% gap) |
| Teruel (Teruel) | €178,304 (€1,495.96/m², N=311) | €145,786 (€586.32/m², N=48) | +22.31% (€32,518) | +16.38% (N=317/50) | Provincial capital (48 resale house sales; 50 total) |
| Chipiona (Cádiz) | €191,364 (€2,270.86/m², N=324) | €205,361 (€1,985.11/m², N=91) | -6.82% (€-13,997) | +14.69% (N=551/97) | Higher all-sales flat average, but higher resale house average |
| Soria (Soria) | €146,249 (€1,581.22/m², N=367) | €158,777 (€1,475.99/m², N=82) | -7.89% (€-12,528) | +9.45% (N=508/83) | Higher all-sales flat average, but higher resale house average |
| León (León) | €143,798 (€1,462.57/m², N=1,322) | €149,293 (€991.44/m², N=193) | -3.68% (€-5,495) | +3.33% (N=1,505/194) | Higher all-sales flat average, but higher resale house average |
| Murcia (Murcia) | €149,858 (€1,510.55/m², N=3,937) | €153,926 (€1,044.82/m², N=1,445) | -2.64% (€-4,068) | +1.63% (N=4,665/1,530) | Higher all-sales flat average, but higher resale house average |
Where Houses Sell for More per Square Metre
In some places, single-family houses also sell for more per square metre than flats - across Illes Balears as a whole and in 124 of the 560 sampled municipalities.
Nationally and in 51 of the 52 geographic areas in the Notariado statistics, flats sell for more per square metre than houses. In some places, however, houses also sell for more per square metre. At the provincial level, the sole exception is Illes Balears, where single-family houses average €4,383.68/m² compared with €4,116.52/m² for flats (+6.49% higher per square metre for houses).
At the municipal level, single-family houses record a higher average price per square metre than flats in 124 of the 560 municipalities with at least 50 sales of each type (22.14%). The largest percentage differences appear in Benissa (+88.36%, €3,127/m² for houses vs €1,660/m² for flats), Los Montesinos (+71.07%), Daimiel (+66.49%), Andratx (+62.61%), and Conil de la Frontera (+57.92%). These comparisons describe the average properties sold in each municipality, not the prices of otherwise equivalent homes.
Show top 15 municipalities where house €/m² exceeds flat €/m²
| Municipality (Province) | House €/m² | Flat €/m² | House vs Flat €/m² (%) | Flat vs House Total (€ / %) |
|---|---|---|---|---|
| Benissa (Alacant) | €3,126.84/m² (221.6 m², N=160) | €1,660.06/m² (107.2 m², N=85) | +88.36% | €178,041 vs €692,790 (-74.30%) |
| Los Montesinos (Alacant) | €2,555.51/m² (111.3 m², N=65) | €1,493.86/m² (90.8 m², N=107) | +71.07% | €135,678 vs €284,461 (-52.30%) |
| Daimiel (Ciudad Real) | €929.03/m² (93.3 m², N=65) | €558.01/m² (101.9 m², N=149) | +66.49% | €56,876 vs €86,709 (-34.41%) |
| Andratx (Illes Balears) | €10,267.16/m² (278.0 m², N=50) | €6,313.89/m² (107.8 m², N=153) | +62.61% | €680,910 vs €2,854,477 (-76.15%) |
| Conil de la Frontera (Cádiz) | €3,795.94/m² (165.7 m², N=56) | €2,403.68/m² (84.5 m², N=152) | +57.92% | €203,215 vs €628,973 (-67.69%) |
| Maó-Mahón (Illes Balears) | €3,986.16/m² (186.8 m², N=90) | €2,541.14/m² (105.4 m², N=205) | +56.87% | €267,733 vs €744,748 (-64.05%) |
| Calasparra (Murcia) | €889.74/m² (120.0 m², N=97) | €578.57/m² (94.4 m², N=120) | +53.78% | €54,640 vs €106,740 (-48.81%) |
| Alcobendas (Madrid) | €7,070.05/m² (436.1 m², N=93) | €4,715.49/m² (103.5 m², N=797) | +49.93% | €487,949 vs €3,083,607 (-84.18%) |
| Benahavís (Málaga) | €5,812.91/m² (355.7 m², N=172) | €3,962.84/m² (152.9 m², N=396) | +46.69% | €606,054 vs €2,067,842 (-70.69%) |
| Miguelturra (Ciudad Real) | €1,280.62/m² (103.8 m², N=62) | €876.69/m² (103.9 m², N=165) | +46.07% | €91,100 vs €132,937 (-31.47%) |
| Bormujos (Sevilla) | €1,836.47/m² (143.6 m², N=104) | €1,265.77/m² (73.2 m², N=192) | +45.09% | €92,694 vs €263,713 (-64.85%) |
| Catral (Alacant) | €1,118.83/m² (169.9 m², N=76) | €781.84/m² (112.6 m², N=76) | +43.10% | €88,069 vs €190,142 (-53.68%) |
| Peligros (Granada) | €1,536.06/m² (141.8 m², N=70) | €1,078.10/m² (115.1 m², N=53) | +42.48% | €124,064 vs €217,747 (-43.02%) |
| Huércal de Almería (Almería) | €1,144.36/m² (152.1 m², N=129) | €807.46/m² (136.0 m², N=109) | +41.72% | €109,807 vs €174,067 (-36.92%) |
| Puçol (València) | €2,350.63/m² (160.7 m², N=109) | €1,678.56/m² (97.4 m², N=230) | +40.04% | €163,424 vs €377,675 (-56.73%) |
How the Relationship Has Changed Since 2010
Sixteen years of annual figures from Spain's national statistics office (INE, 2010-2025) show how the price gap between flats and houses has changed - and why local historical averages need the same care.
What happened nationally? Spain's official statistics show that single-family houses sold for higher average total prices than flats throughout 2010-2025, while flats sold for more per square metre. But the gap between the two changed considerably.
In 2010, the average flat sold for 20.38% less than the average house (€179,525 vs €225,464). That gap widened to 34.87% in 2013 during the housing downturn and stood at 29.10% in 2022. Between 2022 and 2025, average flat prices rose faster than average house prices (+19.71% vs +5.53%), narrowing the national gap to 19.57% in 2025 (€210,342 vs €261,526) - the closest point in the 16-year series.
What happened in Donostia / San Sebastián? Of the 432 active municipalities tracked by the INE, 12 had single-family house prices suppressed for confidentiality in every year, leaving 420 municipalities with at least one observable comparison year. Among those 420 municipalities, 344 (81.9%, or 79.6% of all 432) never recorded a single year between 2010 and 2025 in which flats had a higher average total price than houses, while 76 (18.1%) did so in at least one year and only 10 municipalities (2.4% of 420, or 2.3% of 432) did so in five or more years. Donostia / San Sebastián (view B in the chart below) is one notable example.
In the INE series, average flat prices in Donostia were 45.08% below average house prices in 2010 (€336,192 vs €612,141), but +7.30% above them in 2024 and +6.43% above them in 2025 (€492,704 vs €462,943), while the 2012 house figure was suppressed by the INE for statistical confidentiality. These figures are annual averages of the properties sold each year - over a period in which the average floor area of houses sold in Donostia changed from 159 m² in 2010 to 107 m² in 2025 - and do not mean that equivalent flats appreciated faster than equivalent houses.
Why are the historical figures presented separately? The INE series (Indicadores Urbanos, Table 69330) reports calendar-year averages from 2010 to 2025 across 432 municipalities. The Notariado figures used earlier in this article come from a separate rolling 12-month dataset published on 21 October 2026 covering all Spanish municipalities (in which Donostia flats averaged €519,592 compared with €588,060 for houses, or -11.64%). Because they are different statistical products with different time windows and coverage, they must not be combined into one continuous timeline.
Show complete 16-year annual INE table (2010-2025: Spain National & Donostia / San Sebastián)
| Year | Spain Flat (€ / €/m²) | Spain House (€ / €/m²) | Spain Diff (%) / Ratio | Donostia Flat (€ / €/m²) | Donostia House (€ / €/m²) | Donostia Diff (%) |
|---|---|---|---|---|---|---|
| 2010 | €179,525 (€1,958/m²) | €225,464 (€1,374/m²) | -20.38% (R=0.796) | €336,192 (€4,223/m²) | €612,141 (€3,840/m²) | -45.08% |
| 2011 | €158,584 (€1,726/m²) | €214,180 (€1,321/m²) | -25.96% (R=0.740) | €321,374 (€3,918/m²) | €693,734 (€4,272/m²) | -53.67% |
| 2012 | €138,657 (€1,469/m²) | €205,675 (€1,233/m²) | -32.58% (R=0.674) | €297,956 (€3,599/m²) | Suppressed (Confidentiality) | - |
| 2013 | €126,441 (€1,359/m²) | €194,145 (€1,183/m²) | -34.87% (R=0.651) | €280,798 (€3,181/m²) | €483,918 (€2,771/m²) | -41.97% |
| 2014 | €131,898 (€1,394/m²) | €197,506 (€1,187/m²) | -33.22% (R=0.668) | €272,532 (€3,182/m²) | €567,085 (€1,708/m²) | -51.94% |
| 2015 | €134,554 (€1,435/m²) | €200,677 (€1,207/m²) | -32.95% (R=0.671) | €295,212 (€3,484/m²) | €494,550 (€2,270/m²) | -40.31% |
| 2016 | €139,064 (€1,491/m²) | €199,647 (€1,202/m²) | -30.35% (R=0.697) | €321,329 (€3,723/m²) | €616,560 (€2,832/m²) | -47.88% |
| 2017 | €144,783 (€1,557/m²) | €204,428 (€1,248/m²) | -29.18% (R=0.708) | €337,252 (€3,983/m²) | €503,904 (€2,790/m²) | -33.07% |
| 2018 | €151,602 (€1,614/m²) | €204,776 (€1,263/m²) | -25.97% (R=0.740) | €344,261 (€4,112/m²) | €529,683 (€2,825/m²) | -35.01% |
| 2019 | €157,480 (€1,677/m²) | €204,510 (€1,277/m²) | -23.00% (R=0.770) | €373,282 (€4,487/m²) | €561,519 (€3,400/m²) | -33.52% |
| 2020 | €162,246 (€1,686/m²) | €208,742 (€1,275/m²) | -22.27% (R=0.777) | €390,557 (€4,518/m²) | €614,814 (€2,807/m²) | -36.48% |
| 2021 | €169,860 (€1,775/m²) | €234,951 (€1,438/m²) | -27.70% (R=0.723) | €393,141 (€4,538/m²) | €467,453 (€2,634/m²) | -15.90% |
| 2022 | €175,709 (€1,859/m²) | €247,825 (€1,550/m²) | -29.10% (R=0.709) | €406,678 (€4,935/m²) | €527,740 (€3,434/m²) | -22.94% |
| 2023 | €177,019 (€1,892/m²) | €241,888 (€1,555/m²) | -26.82% (R=0.732) | €414,772 (€5,026/m²) | €487,675 (€3,436/m²) | -14.95% |
| 2024 | €192,733 (€2,039/m²) | €249,583 (€1,599/m²) | -22.78% (R=0.772) | €466,198 (€5,472/m²) | €434,487 (€4,267/m²) | +7.30% |
| 2025 | €210,342 (€2,240/m²) | €261,526 (€1,674/m²) | -19.57% (R=0.804) | €492,704 (€5,912/m²) | €462,943 (€4,322/m²) | +6.43% |
What Average Property Prices Don't Tell You
Average property prices are a useful starting point for tracking the housing market, but a single figure for a country, province, or town cannot tell you what was actually sold.
Across Spain, apartments and houses sell in very different places and in very different sizes. In Zaragoza, combining sales from the capital city with sales from smaller towns across the province produces a province-wide average that says the opposite of what happens in both areas separately. In a smaller group of towns, flats continue to record higher average prices even when we look only at resale homes sold within the same municipality.
In neither case are the official statistics wrong. What changes is the mix of homes behind the calculation - whether sales took place in a provincial capital or a rural village, whether they involved newly built developments or older stock, and how large the homes were.
Understanding which properties were sold, and where, is often the difference between a useful benchmark and a misleading conclusion. Before taking any headline property average at face value, it pays to ask a simple question: what exactly went into that number?
Frequently asked questions
Do apartments or houses cost more in Spain?
Across Spain as a whole, single-family houses cost more in total purchase price (€251,605 vs €219,274 for apartments, a -12.85% difference for flats), while apartments cost +62.93% more per square metre (€2,385.89/m² vs €1,464.37/m²). Houses cost more in total because the average house sold is nearly twice as large as the average flat (171.8 m² vs 91.9 m²).
In how many Spanish provinces do apartments sell for more than houses?
In 20 of the 52 geographic areas covered by the Notariado's provincial statistics (Spain's 50 provinces and the autonomous cities of Ceuta and Melilla), the average notarized total price of an apartment exceeds that of a single-family house in the rolling 12-month dataset published on 21 October 2026. In nine provinces the difference exceeds +10%, led by Teruel (+54.89%), Cuenca (+54.86%), and Albacete (+43.43%).
Can average property prices be misleading?
Yes. An average can be mathematically accurate but still give a misleading impression if it combines properties sold in very different locations or market segments. Zaragoza provides an example: houses have higher average prices in both the capital (€277,081 vs €189,936) and the rest of the province (€114,877 vs €103,392), yet the combined provincial average is +20.02% higher for flats because the two property types are sold in different proportions across those areas (77.58% of flat sales in the capital vs 83.23% of house sales outside it).
Where do apartments have higher average prices than houses within the same municipality?
Among the 560 Spanish municipalities with at least 50 total sales of each type, flats have a higher average total price than houses in 35 municipalities (6.25%). When restricted to resale homes (segunda mano), 29 of the 522 municipalities with at least 50 resale sales of each type recorded a higher average resale flat price in the October 2026 release (5.56%), and 17 municipalities met our full three-part filter (at least 50 resale sales of each type, at least a +5% higher resale flat average in October 2026, and a positive resale flat gap across all three 2026 Notariado releases) - including Tavernes de la Valldigna (+32.34%), Lorca (+15.22%), Bilbao (+6.77%), and Ontígola (+5.52%). Teruel capital (+22.31% in resale) is reported alongside them with 48 resale house sales (50 house sales in total).
Why do total prices and prices per square metre point in opposite directions?
Total purchase price equals price per square metre multiplied by floor area. Nationally, apartments sell for a higher average price per square metre (€2,385.89/m² vs €1,464.37/m², or +62.93%), whereas single-family houses have nearly twice the average floor area (171.8 m² vs 91.9 m², a 1.87x ratio). Because the larger floor area of houses outweighs the higher per-square-metre price of flats, the average house sells for a higher total price (€251,605 vs €219,274).
Are there places in Spain where houses cost more per square metre than apartments?
Yes. Illes Balears is the only province where single-family houses exceed apartments in price per square metre (€4,383.68/m² vs €4,116.52/m², or +6.49% higher for houses). At the municipal level, houses exceed flats in €/m² in 124 of 560 sampled municipalities (22.14%), led by Benissa (+88.36%), Los Montesinos (+71.07%), Daimiel (+66.49%), Andratx (+62.61%), and Conil de la Frontera (+57.92%).
Why are Notariado and INE housing price figures presented separately?
The Consejo General del Notariado dataset covers a rolling 12-month window of notarized deeds (published 21 October 2026 across all Spanish municipalities), whereas the INE Urban Indicators series (Table 69330) reports annual calendar-year averages from 2010 to 2025 for 432 municipalities. Because their time windows, municipal coverage, and aggregation rules differ, combining them into a single timeline would distort the comparison.
Do these transaction averages measure like-for-like property value?
No. Average transaction prices describe the properties actually sold during each period, not the value of equivalent homes. Neither official source adjusts for building age, renovation condition, plot size, energy rating, or exact street location, so observed differences reflect the real mix of flats and houses sold in each area.
How we researched this
This study combines two official Spanish residential transaction sources without merging their time horizons: (1) the Consejo General del Notariado (Portal Estadístico del Notariado) rolling 12-month dataset of notarized residential deeds (data captured on 21 October 2026, covering 614,604 transactions across 50 provinces and the autonomous cities of Ceuta and Melilla, plus 8,124 municipalities, cross-checked against earlier snapshots captured on 3 September and 24 September 2026), and (2) the Instituto Nacional de Estadística (INE) Indicadores Urbanos dataset (2026 edition, Table 69330, annual calendar-year housing transaction indicators covering 2010-2025).
All figures are computed directly from official transaction counts, mean prices per square metre and mean surface areas, with zero interpolation, synthetic estimation or cross-geography fallback. Because these datasets record transaction averages rather than repeat-sales valuations of identical homes, they do not adjust for unmeasured characteristics such as building age, renovation state, plot size or exact micro-location.
Detailed sources, definitions, and sample-size sensitivity
1. Authoritative Data Sources & Official Registries
The cross-sectional analysis draws on the Consejo General del Notariado (Portal Estadístico del Notariado) official residential transaction statistics (rolling 12-month dataset captured on 21 October 2026, with stability verification across earlier snapshots captured on 3 September and 24 September 2026). The Notariado records classify properties into apartments in collective buildings (pisos) and single-family houses (viviendas unifamiliares), broken down across all sales, new-build homes (vivienda nueva) and resale homes (vivienda de segunda mano). The 16-year historical analysis draws on the Instituto Nacional de Estadística (INE) Indicadores Urbanos publication (2026 edition, Table 69330, annual calendar-year housing transaction statistics covering 2010-2025 for collective dwellings and single-family dwellings).
2. Exact Weighted Price & Surface Formulas
For each geographic unit and property segment, Notariado reports mean price per square metre (Pm²), mean surface area in square metres (S) and transaction count (N). Mean total transaction price is computed as Ptotal = Pm² x S. When combining new-build and resale segments, pooled transaction count is Nall = Nnew + Nresale, pooled mean total price is weighted by transaction count as (Nnew x Ptotal,new + Nresale x Ptotal,resale) / Nall, and pooled mean price per square metre is weighted by total transacted floor area.
3. Capital vs Rest-of-Province Decomposition (Simpson's Paradox Test)
For each province, the non-capital aggregate ("Rest of Province") is derived algebraically from the provincial total and the provincial capital municipality: non-capital transaction count is Nrest = Nprov - Ncap, and non-capital mean price is (Nprov x Pprov - Ncap x Pcap) / Nrest. A province exhibits a local-to-provincial Simpson's paradox reversal when apartments have a lower average total price than houses both in the capital city and across the rest of the province, yet a higher average total price when all provincial transactions are combined. Ten provinces show a clear reversal under this test, while an eleventh (Granada, +0.39% provincial difference, €153,725 vs €153,124) sits at near-parity (€602 apart).
4. Sample-Size Thresholds & Multi-Snapshot Stability
Municipal rankings apply explicit minimum transaction thresholds so small-sample noise cannot drive headline conclusions: at least 50 transactions per property type for main municipal total-price comparisons (560 qualifying municipalities across all sales; 522 in resale), combined with at least a +5% resale price difference and positive differences across all three 2026 Notariado snapshots for the 17 highlighted resale towns, and at least 30 transactions per property type for the €/m² counter-pattern analysis (757 qualifying municipalities).
5. Scope, Confidentiality Suppression & Limitations
Both official datasets report transaction-weighted averages of properties sold during each observation period rather than repeat-sales indices or hedonic valuations of identical homes. Differences in average prices therefore reflect the size, age, condition and location of homes sold in each segment. Where municipal cells fall below statistical confidentiality thresholds (such as Donostia/San Sebastián single-family houses in 2012 in INE Table 69330), values are left blank and never interpolated.
How to Cite or Reuse This Research
Journalists and publishers are welcome to reference this research. Please credit BarrioRadar as the source of the analysis and include a link to the original study.
Charts and visualizations: BarrioRadar. Underlying transaction data: Consejo General del Notariado and Instituto Nacional de Estadística (INE), as applicable.